Classification Demo:
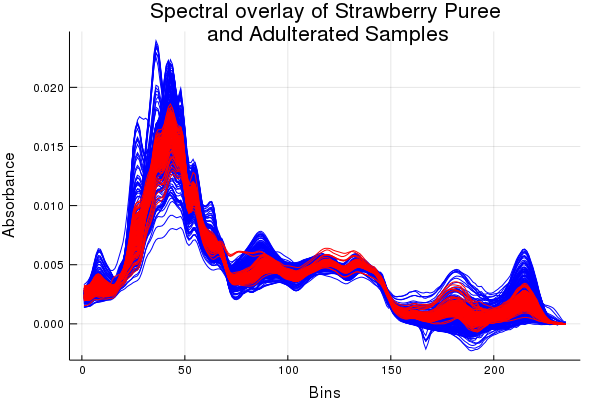
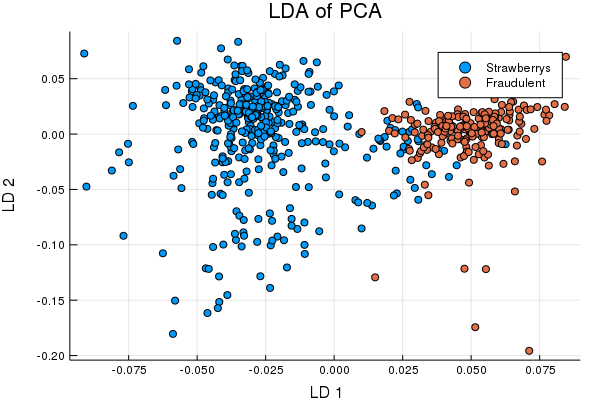
This demo shows an applied solution to a classification problem using real mid-infrared data. If you want to see the gambit of methods included in ChemometricsTools check the classification shootout example. There's also a bunch of tools for changes of basis such as: principal components analysis, linear discriminant analysis, orthogonal signal correction, etc. With those kinds of tools we can reduce the dimensions of our data and make classes more separable. So separable that trivial classification methods like a Gaussian discriminant can get us pretty good results. Below is an example analysis performed on mid-infrared spectra of strawberry purees and adulterated strawberry purees (yes fraudulent food items are a common concern).

Use of Fourier transform infrared spectroscopy and partial least squares regression for the detection of adulteration of strawberry purées. J K Holland, E K Kemsley, R H Wilson
snv = StandardNormalVariate(Train);
Train_pca = PCA(snv(Train);; Factors = 15);

Enc = LabelEncoding(TrnLbl);
Hot = ColdToHot(TrnLbl, Enc);

lda = LDA(Train_pca.Scores , Hot);
classifier = GaussianDiscriminant(lda, TrainS, Hot)
TrainPreds = classifier(TrainS; Factors = 2);
Cool right? Well, we can now apply the same transformations to the test set and pull some multivariate Gaussians over the train set classes to see how we do identifying fraudulent puree's,
TestSet = Train_pca(snv(Test));
TestSet = lda(TestSet);
TestPreds = classifier(TestS; Factors  = 2);
MulticlassStats(TestPreds .- 1, TstLbl , Enc)
If you're following along you'll get a ~92% F-measure depending on your random split. Not bad. You may also notice this package has a nice collection of performance metrics for classification on board. Anyways, I've gotten 100%'s with more advanced methods but this is a cute way to show off some of the tools currently available.